
In today’s analysis we will look at the market with Ethereo (ETH), which means that we will take a short break from Bitcoin again. But not for long, because we will say a lot in tomorrow’s video analysis. Otherwise, in yesterday’s analysis on Bitcoin, I pointed out that the dollar index is most likely to close close to 92 points, which it did. So is this a big bad one?
Hard to say. However, we know that the US dollar has probably definitely bottomed out, but we will take a closer look at this in Sunday’s video analysis. Otherwise, just in these moments, Bitcoin broke through to the new all-time high and the altcoins are already starting to wake up. As deliberately as we can get this time.
Notice for tomorrow’s video analysis:
During the second half of Sunday afternoon, I will release a video analysis on Bitcoin again. As soon as this happens, you will of course be notified. You can look forward to another analysis full of useful information, where we will explain important contexts that you will not learn from most other analysts.
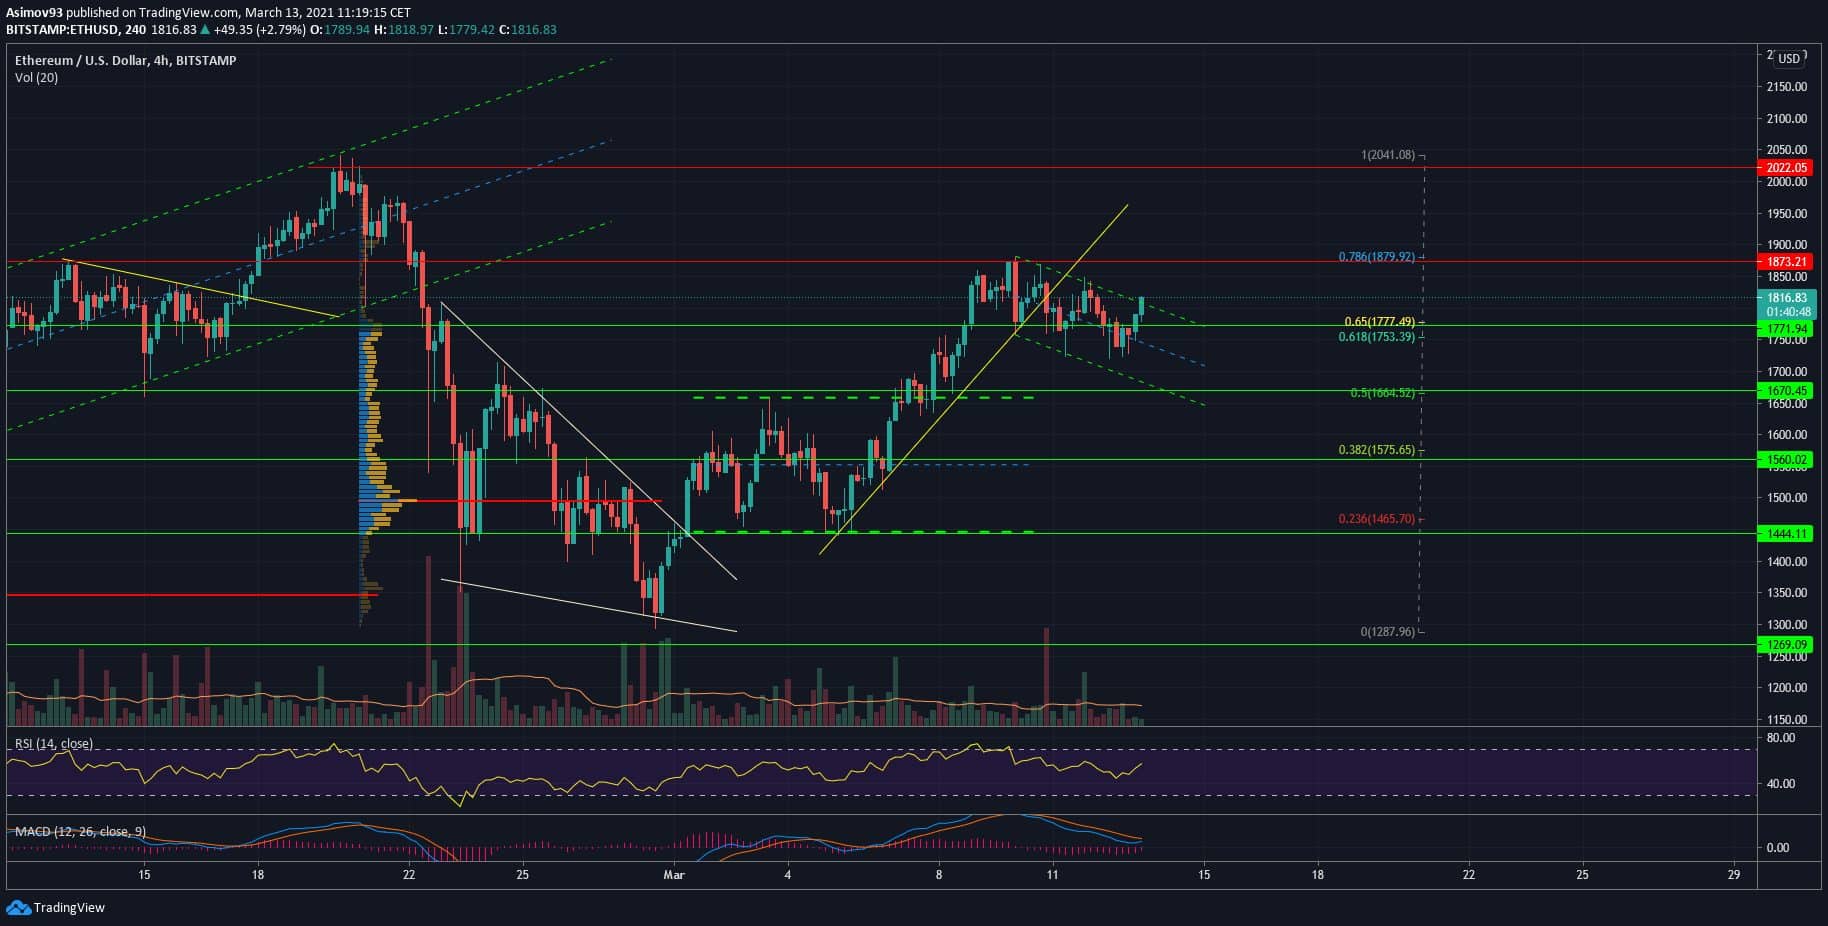
Current situation at 4H TF ETH / USD
So Ethereum (ETH) was already able to cover about 80% of the losses from the last correction, which, however, did not last very long. However, in order not to overtake, as we said in the previous analysis at Ethereum, the exchange rate consolidated the first week of March within the drawn trading zone, from which it managed to break through on March 7. Then there was a throwback with a nice retest and we continued up.
He created a new but brief trend, which was conditioned by the drawn diagonal. The mentioned trend lasted until the S / R level of USD 1,873, where there was an immediate rejection and the price returned to the S / R level of USD 1,771. Then came the second attempt to break through the resistance, which again failed. The trend was broken and in a short time the price fell below the S / R level of 1,771 USD.
Then it happened once more, but in general the price tended to stay in the range of 1,771 – 1,873 USD. In fact, thanks to the price action, a bull flag / small channel has been created, from which a breakout is taking place. So we’re testing $ 1,873 again for 100%. If the momentum is strong enough, we will definitely break through.
After breaking the said limit, it remains to conquer the S / R level of 2,022 USD, which in my opinion should not be such a problem. This will be a great opportunity for ETH, because if the current historical boundary is broken, it means that we will move in price relations 2 xxx. Therefore, the psychological effect will undoubtedly be significant.
Indicators
4H RSI starts to gain a positive momentum and in fact at the moment when the price attacks the resistance, the curve of the indicator attacks the border 70 points. Any breakthrough is undoubtedly a bullish sign. As for MACD, there is a bullish cross. So we have another positive signal for the way up.
In conclusion
Ethereum (ETH) is definitely doing well, and in fact I would venture to say that the potential is much greater than on Bitcoin. Unfortunately, the further development is decided mainly by BTC and there it is quite risky. Our king is just still quite hyped, which is not good for everything else. Personally, I am of the opinion that a possible correction would be of great benefit to altcoins. Respectively, after clearing the Bitcoin market, the altos could go boldly without any major risk.
ATTENTION: No data in the article is an investment board. Before you invest, do your own research and analysis, you always trade only at your own risk. The kryptomagazin.cz team strongly recommends individual risk considerations!
–
