
When I yesterday talking about the advent of dynamics, I did not expect it to be so fast. Bitcoin (BTC) suddenly pumped last night and according to the lower time frames, it was already clear that we were going to make another higher peak. And now we seem to be testing the resistance of $ 52,500. But that doesn’t change the pitfalls that I’ve more or less summarized in previous analyzes.
Current situation at 1D TF BTC / USD
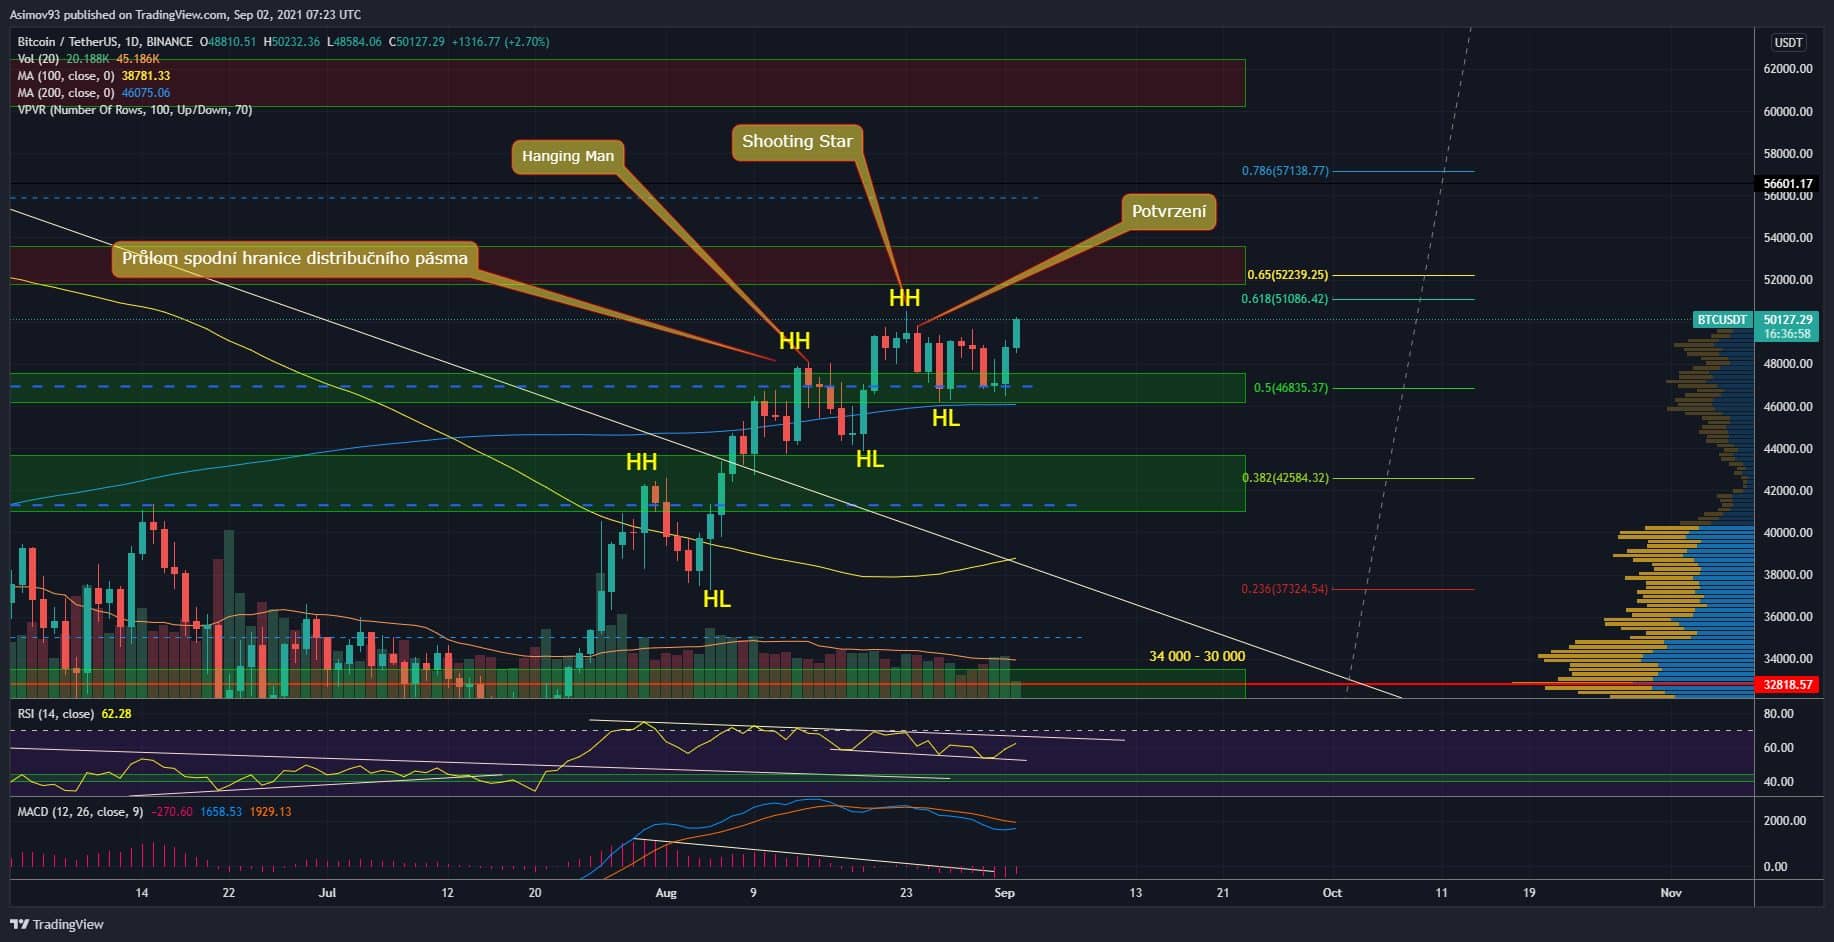
The last day of August was not very good for Bitcoin, as the attempt to bounce was immediately trampled to the ground. On the other hand, as long as he held $ 47,000 in support, there was still an opportunity to bounce back and create a new peak. Which started last night and is happening today. Respectively, the high of August 23 has not been surpassed by only USD 50.
At the moment, however, the market is so close that it will probably succeed. At the current inertia we can calculate that the resistance confluence we will test around $ 52,500. This confluence is formed by price resistance, Low Volume Node and the so-called Golden Ratio on the Fibonacci sequence.
And after the testing itself, it remains to be seen whether Bitcoin is really capable of breaking through. This would greatly minimize the possibility that this is the case bull trap as was the case, for example, at the beginning of 2018. In terms of volumes, in the context of the summer standard, long-term below average.
Indicators
We already have the fifth lower peak at RSI, so we have the fifth divergence in the collection. That is, assuming that today’s close ends above the close on August 23. However, the last divergence is already quite greasy. Negative momentum prevails in MACD, negative correlations still apply.
Current situation at 4H TF BTC / USD
On the 4H chart, I marked the first strong growth candle, which, however, closed in a very unflattering form. In short, the bears immediately withdrew most of their growth. The volumes at the candle were one of the largest in the last few months. Therefore, there was indeed a significant absorption of demand. However, the price continued to rise anyway.

The first mentioned development is, of course, bearish, but if the price continues to expand anyway, it means that it will continue to do so demand manages to absorb supply. Which, on the other hand, is bullish. In any case, Price Action is very solid in terms of the 4H chart. Momentum is strong, for example, we will see 52,500 USD testing today. The course is quite close.
In conclusion
Yesterday’s pump clearly gave the market self-confidence and, most importantly, the necessary momentum. Above all, something is finally happening and we are not paying for ourselves on the spot. I’d love to finally test the $ 52,500, because that brings us one step closer to the final resolution. If we break through the resistance and the course stays above the surface, we will probably test ATH.
ATTENTION: No data in the article is an investment board. Before you invest, do your own research and analysis, you always trade only at your own risk. The kryptomagazin.cz team strongly recommends individual risk considerations!
–
