
The week ended yesterday and the weekly chart is showing a bearish trend. The ceiling turned out to be too strong and the price of bitcoin has fallen through several floors. In my view, this trend is news-driven because nothing has changed with the foundation of bitcoin – and the largest altcoins.
Of course, the Ukraine problem plays a major role. Vitalik Buterin (co-founder of the Ethereum blockchain), meanwhile, has coined the word “crypto winter.” However, it is not all doom and gloom. Let’s look at the charts, with prices in dollars.
Positive becomes negative
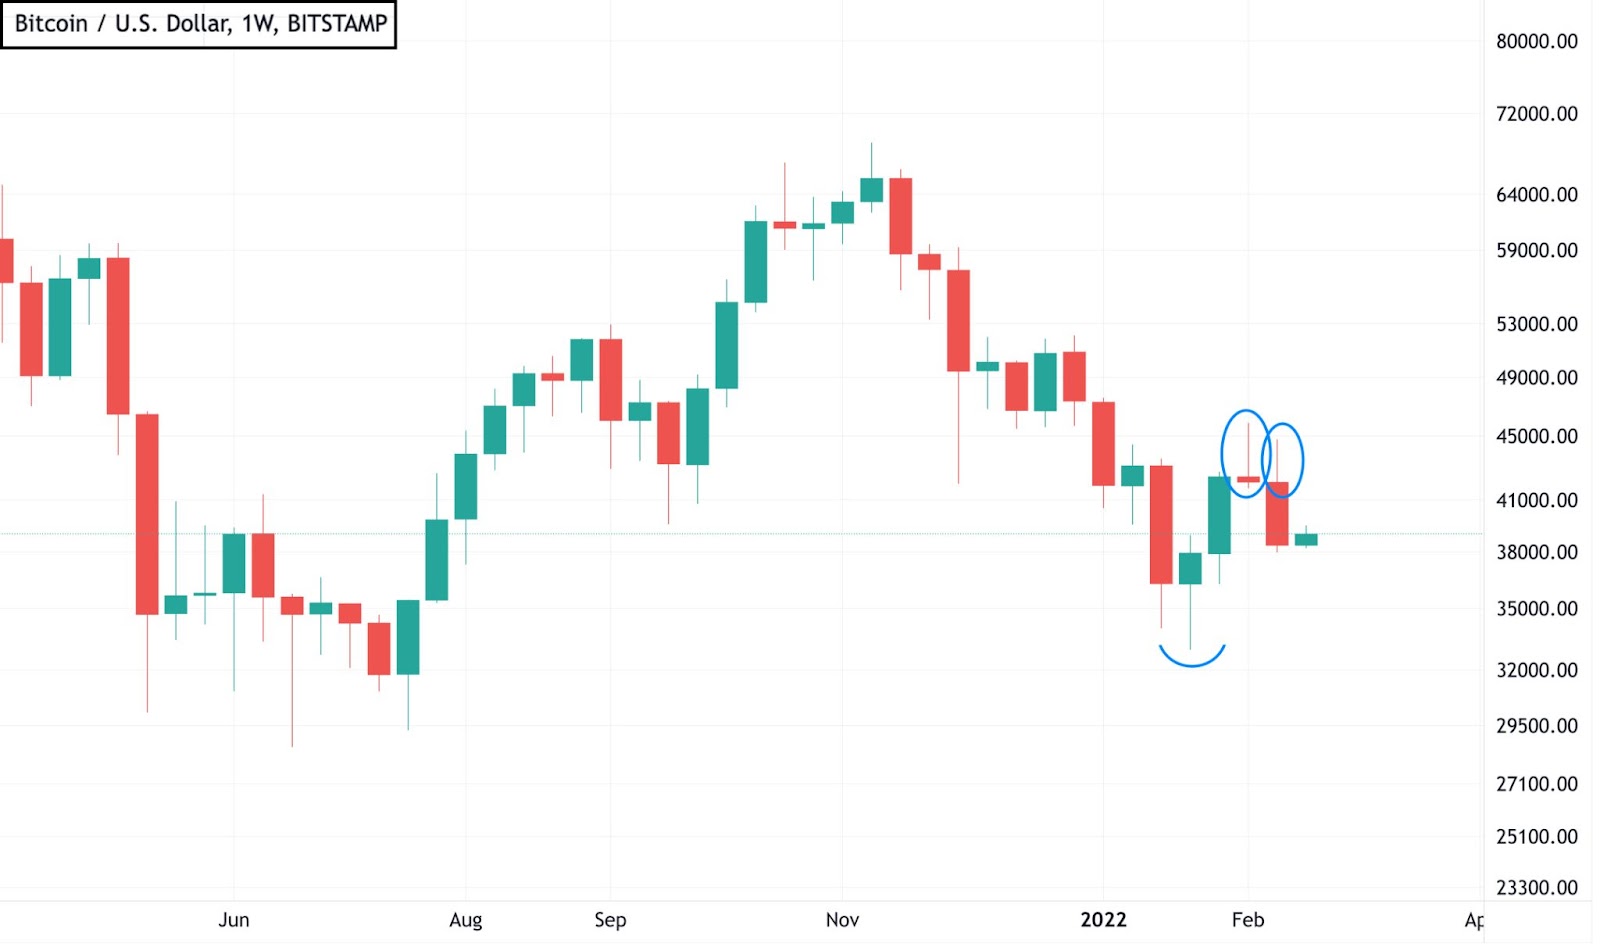
In the chart in which each candle represents one week, we see from the top (beginning of November) that the successive troughs are lower and that also applies to the peaks. After falling four weeks ago, the price moved up resulting in two green candles. But, last week I wrote about the pin bar (a narrow-bodied candle with a long wick at the top making it look like a pin) that didn’t bode well. It turned out to be a new peak, which is lower than the previous one. This affected candle, plus the last closed candle, indicate rejection at the top. Until recently, the target seemed to be moving towards $ 50,000, currently the bulls are licking their wounds and the price has even fallen through $ 40,000 (35,200 euros).
Double top played?
If we zoom in a bit and look at the daily chart, we see a significant drop after the double top. The bearish ‘double top pattern’ had a price target of around USD 38,700 (EUR 34,000). The price actually moved slightly lower over the past weekend, bouncing off the floor (shown below as the red bar). If this floor does not hold, then there is a trendline below it (black line).

At the end of July 2021, this line was at $29,300 and the last time the line was tested, the price was about $ 35,000. Should the sentiment become so negative that the price drops through it, the price level of the end of July 2021 will come into view again.
If the line does hold, then it is confirmation that the bottom has been reached around January 23. Interesting to keep an eye on!
Buyers are ready
In the short term, the one hour chart, we see the price swinging back and forth between the 50 EMA (blue) and the 20 EMA (red). EMA stands for Exponential Moving Average and it is a line that calculates the candles before it, with the last candles counting more heavily. Both lines can serve as support and resistance in themselves, but given the negative sentiment, the red line is more likely to be crossed downwards. Nevertheless, there will also be enough buyers in the area of the red zone who will start from 38,100 (33,540 euros).

In summary, the general trend is bearish right now. But belief in bitcoin and many other cryptocurrencies remains strong.
It might be good to know that the two stablecoins USDT and USDC have a combined market capitalization of more than $130 billion. They currently rank 3 and 5 as the largest cryptocurrencies and are growing rapidly. On the one hand, it is because cryptocurrencies are sold for these stablecoins (which are not exchanged for dollars or euros). On the other hand, more of these coins are being bought. This could mean that investors are sitting on the sidelines waiting for a sign to step in. If that happens, it can go back up quickly.
–

