
Bitcoin (BTC) ended another week, which also took us to 2022. But this is not logically the only important event, as we had the end of the month and the quarter at the same time. Right in On Sunday’s video analysis, I emphasized the seriousness of the final form last closed quarterly candles. For the sake of completeness, I will briefly present it in today’s analysis.
Current situation at 3M BTC / USD
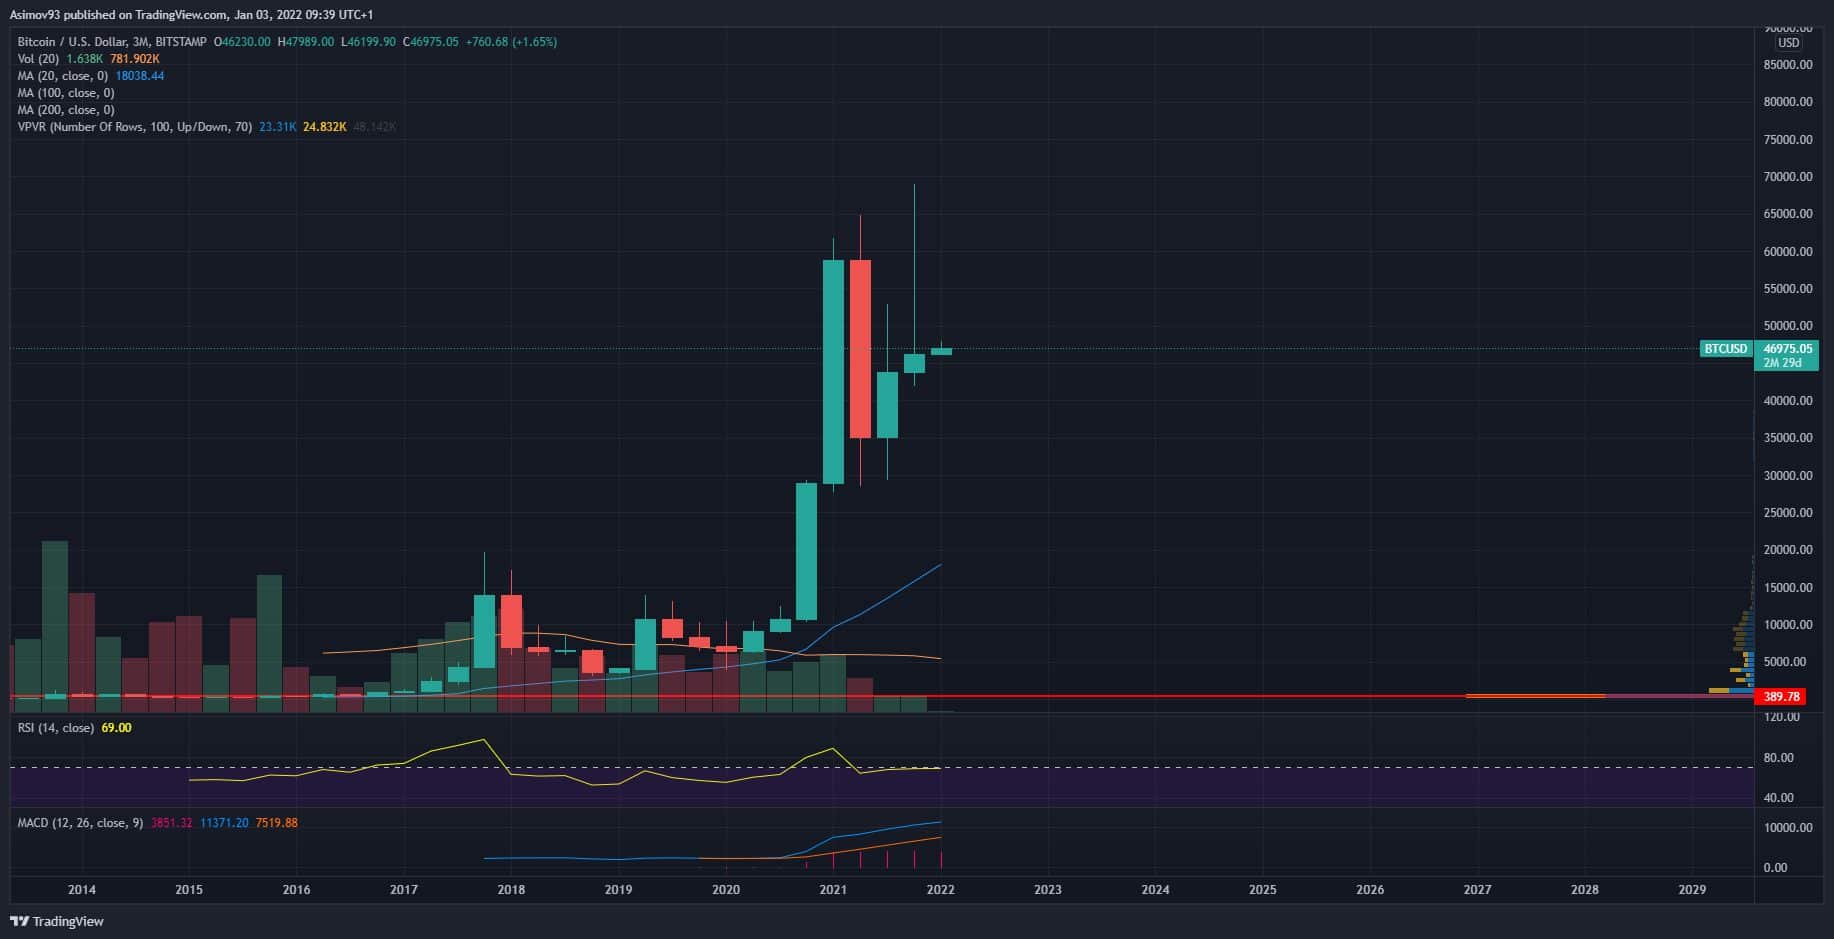
For completeness, therefore, I enclose a three-month chart on a linear scale. The chart does not look good at all, because the candle from the second quarter looks awful and the candle from the last quarter closed in the form Shooting star. In Czech, it is a shooting star. In any case, the long upper wick at the candle means that demand was completely absorbed by supply.
In addition, the appearance of the candle is completely textbook and appeared at a potential peak for more than 10-year bull trend. To be completely honest, this is important for Bitcoin turn signal. It really looks like a potential peak.
Again, I would like to point out that we do not see into the future – we must monitor other factors that will confirm or refute this. In addition, there is some hope until S/R level $ 30,000 is not broken.
Current situation at 1W BTC / USD
As for the market view according to the weekly time frame, Bitcoin has clearly not moved anywhere. The closed weekly candle is more or less the same as the previous two. But important to us is the fact that we see a rejection close to $ 52,500. So far, this has only been known in the lower time frames. Now it is confirmed here as well.

The weekly close is below again 50-week moving average. If Bitcoin continues to decline, after a year and a half it will trade just below this dynamic level. In other words, we will lose a lot of significant support as the exchange rate continues to fall. Another important dynamic support is 100-week moving averagewhich is currently close to $ 30,000.
Indicators
Weekly RSI is now 46 points. We are therefore quite close to the strong levels, which are around 40 points. According to MACD the negative momentum grows stronger.
In conclusion
The potential top of the entire bull trend has been forming in the chart for more or less a year. I add that this is not a scare or an attempt to foretell future developments. It is clear from the graph that something big has been happening on the BTC market for a year. It’s preparing for something big. Of course, no one knows exactly what will happen. Let us leave such activities to the charlatans, respectively, and we will determine for sure whether it is not risk too big.
ATTENTION: No data in the article is an investment board. The analysis does not try to predict future price developments. It serves exclusively as an educational text on how to approach the market mentally. Before you invest, do your own research and analysis, you always trade at your own risk. The kryptomagazin.cz team strongly recommends individual risk considerations!
–

