
General characteristics of the study population
Table of Contents
Among 1328 patients with colorectal polyps, 1088 were male and 240 were female, with a male-to-female ratio of 4.53:1. Among 1388 patients in the non-polyp group, 1049 were male and 339 were female, with a male-to-female ratio of 3.09:1. When comparing the sex ratios of the two groups using the chi-square test, there was a statistically significant difference (χ2 = 16.322, p < 0.001). It is believed that men are more prone to colorectal polyps than women (Table 2).
Sex ratios were compared between the adenomatous polyp group and the non-adenomatous polyp group. Among 474 patients with adenomatous polyps, 396 were male and 78 were female, with a male-to-female ratio of 5.07:1. Among 854 patients with non-adenomatous polyps, 692 were male and 162 were female, with a male-to-female ratio of 4.27:1. There was no statistically significant difference in sex ratios between the adenomatous polyp group and the non-adenomatous polyp group (χ2 = 1.301, p = 0.254).
As shown in Table 3, the average age of onset for patients with colorectal polyps was 50.03 ± 7.881 years old. Among them, the average age of onset for males was 50.12 ± 7.846 years old, and the average age of onset for females was 49.67 ± 8.044 years old. The incidence rate was high among people over 40 years old, accounting for 89.98% of the total population. Therefore, this study suggests that individuals over 40 years old should complete at least one colonoscopy screening.
Differences in clinical biochemical indicators and related derived indicators were compared between the two groups. All of these indicators are quantitative data. First, a normality test was performed on the data. Among them, BMI, TyG-BMI, diastolic blood pressure, MAP, total cholesterol, LDL-C, ApoB, uric acid, TP, and globulin followed a normal distribution, so t-test was used to analyze. As shown in Table 4, the results showed statistically significant differences in BMI, TyG-BMI, diastolic blood pressure, MAP, and ApoB between the polyp group and the non-polyp group. The BMI, TyG-BMI, diastolic blood pressure, MAP and ApoB were higher in the polyp group than in the non-polyp group (p < 0.05). Age, TyG, TG/HDL-C, METS-IR, FBG, SBP, TG, HDL, ApoA1, CEA, CA199, urea, blood creatinine, FT3, TSH, FT4, ALT, AST, TBIL, IBIL, ALB, alkaline phosphatase, and total bile acids exhibited skewed distribution, thus non-parametric tests were employed. The results revealed statistically significant differences in age, TyG, TG/HDL-C, METS-IR, FBG, SBP, TG, HDL-C, CEA, FT3, total bilirubin, indirect bilirubin, and ALB between the polyp and non-polyp groups (p < 0.05). Age, TyG, TG/HDL-C, METS-IR, FBG, SBP, TG, CEA, FT3, TBIL, and IBIL levels were higher in the polyp group compared to the non-polyp group, whereas HDL and ALB levels were lower in the polyp group compared to the non-polyp group.
Univariate analysis of risk factors for colorectal polyp occurrence
Sixteen factors related to the occurrence of colorectal polyps, identified through univariate analysis, were used as variables for univariate logistic regression analysis. The results showed that sex, age, BMI, FBG, TyG-BMI, TyG, TG/HDL-C, METS-IR, MAP, and CEA were risk factors for the occurrence of colorectal polyps, while HDL-C was a protective factor for the occurrence of colorectal polyps. The above results are shown in Table 5.
The forest plot shows that there are statistically significant differences in CEA (OR = 1.121, 95% CI: 1.008–1.248, p < 0.05) and HDL-C (OR = 0.746, 95% CI: 0.597–0.932, p < 0.05) between the adenoma group and the non-adenoma group. There are also statistically significant differences in MAP (OR = 1.013, 95% CI: 1.005–1.022, p < 0.05), METS-IR (OR = 1.797, 95% CI: 1.197–2.697, p < 0.05), TG/HDL-C (OR = 1.054, 95% CI: 1.019–1.090, p < 0.05), TyG (OR = 1.536, 95% CI: 1.120–2.108, p < 0.05), TyG-BMI (OR = 1.006, 95% CI: 1.001–1.101, p < 0.05), and Age (OR = 1.045, 95% CI: 1.035–1.056, p < 0.05) between the two groups (as show in Fig. 1).
A binary logistic regression analysis was conducted using four insulin resistance-related indicators and MAP (Table 6). The results showed that TyG, TyG-BMI, and MAP were identified as risk factors for the occurrence of colorectal polyps when analyzing these five indicators, consistent with the results of the univariate analysis. However, it was found that the p-values for TG/HDL-C and METS-IR were greater than 0.05. Considering the influence of other factors, TyG, TyG-BMI, and MAP appeared to have greater predictive value. In Models 2 and 3, after controlling for multiple factors such as sex, age, CEA, FT3, etc., MAP and TyG-BMI were found to have better predictive ability.
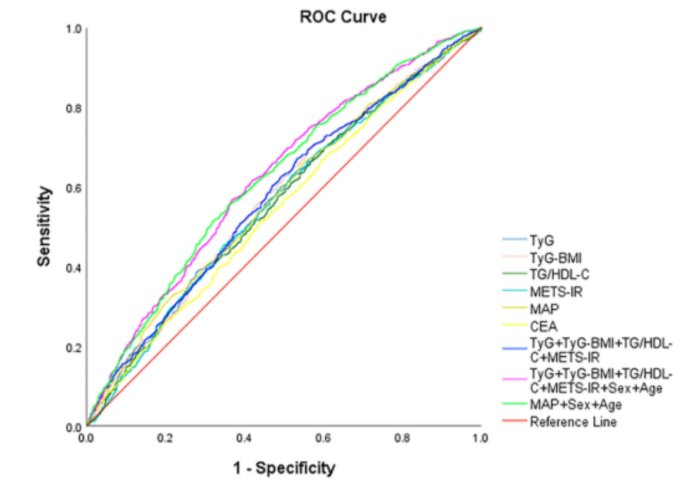
ROC curve analysis results show that in the overall population, the AUC of TyG, TyG-BMI, TG/HDL-C, METS-IR, MAP, CEA, and their combination with sex and age are all greater than 0.5 (p < 0.05), indicating a certain predictive value for the occurrence and development of colorectal polyps. The descending order of AUC values for individual indicators is as follows: TyG-BMI (0.574, 95% CI 0.550–0.598), MAP (0.574, 95% CI 0.550–0.597), TyG (0.567, 95% CI 0.544–0.591), METS-IR (0.563, 95% CI 0.539–0.587), TG/HDL-C (0.561, 95% CI 0.537–0.585), CEA (0.546, 95% CI 0.522–0.570). The descending order of AUC values for combined indicators is as follows: TyG + TyG-BMI + TG/HDL-C + METS-IR + Sex + Age (0.625, 95% CI 0.602–0.648), MAP + Sex + Age (0.624, 95% CI 0.601–0.647), TyG + TyG-BMI + TG/HDL-C + METS-IR (0.577, 95% CI 0.553–0.601), as shown in Fig. 2; Table 7. Based on these results, we conclude that the combined insulin resistance-related indicators, MAP, sex, age, and CEA can better predict the occurrence of colorectal polyps.

Receiver operating characteristic (ROC) curve of makers of insulin resistance and the combination.