
NASA Visualization Reveals Stunning Global Aerosol Migration, Highlights Impact of Dust, Wildfires & Storms
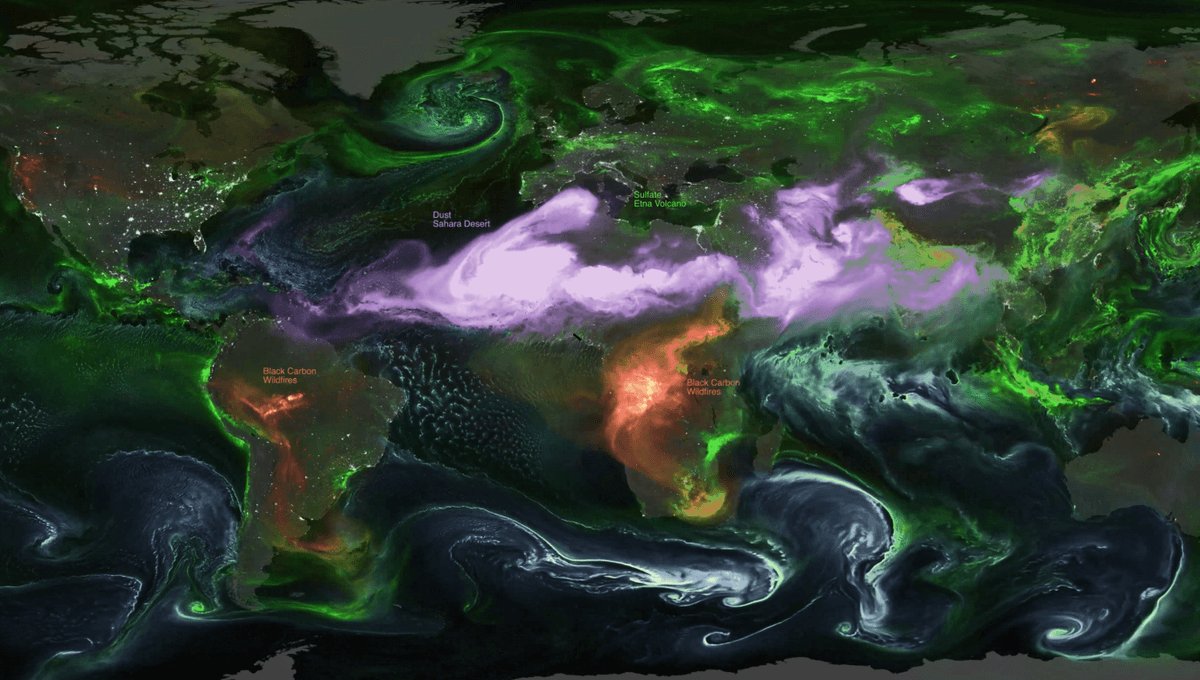
WASHINGTON D.C. – A new visualization from NASA’s Scientific Visualization Studio offers a breathtaking look at the constant, planet-wide movement of aerosols – microscopic particles suspended in the Earth’s atmosphere. The data, spanning August 1st to September 14th, 2024, reveals the complex interplay of natural and human-caused factors influencing air quality and weather patterns.The visualization, created using NASA’s Goddard Earth Observing System, utilizes data from satellites, ground measurements, and weather stations to map the journey of these particles. Each aerosol type is color-coded: deep blue represents sea salt from storms, magenta signifies desert dust, fiery orange and red depict smoke from wildfires, and bright green indicates sulfate particles originating from pollution and volcanic activity.
A especially striking feature is a massive plume of Saharan desert dust traveling westward across the Atlantic Ocean. This significant event, observed throughout the summer of 2024, impacted air quality in the caribbean, Florida, and Texas.
The visualization also highlights the impact of volcanic eruptions, showcasing streams of sulfate particles emitted from Hawaii’s Kilauea volcano and Italy’s Mount Etna. Concerningly, substantial wildfire smoke is visible originating from seasonal agricultural burning in southern Africa and intense wildfires and deforestation in South America.
The movement of aerosols directly reflects major weather systems. Hurricane Ernesto is clearly visible in the western Atlantic as a spiraling cloud of sea salt, sulfates, and dust. Similarly, Typhoons Shanshan and Ampil near Japan are shown drawing in pollution from mainland Asia.
While human-made air pollution contributes to the green data points on the map, primarily emanating from industrial and urban areas, NASA emphasizes that the majority of aerosols have natural origins.
NASA’s goal in mapping these airborne journeys is to provide communities and researchers with the tools to anticipate changes in air quality and visibility, and to deepen our understanding of the dynamic atmosphere.The visualization serves as a powerful reminder of the interconnectedness of our planet’s systems.
Sources: NASA’s Scientific Visualization studio data (August 1 – september 14, 2024) and Goddard Earth Observing System.