
The glycan profile of HEK293T and HEK293T-hACE2 cell line using lectin probes
Table of Contents
- The glycan profile of HEK293T and HEK293T-hACE2 cell line using lectin probes
- Homology-based structural prediction and modeling of the chimeric tsCRD-MrNV-VLPs
- The expression of the tsCRD-MrNV capsid gene into E. coli led to the efficient production of virus-like particles with an icosahedral structure
- The tsCRD-MrNV-VLPs demonstrated both binding specificity and internalization into ACE2 receptor-overexpressing HEK293T-hACE2 cells
- tsCRD-MrNV-VLPs were capable of blocking and reducing various variants of SARS-CoV-2 pseudovirus infection in HEK293-hACE2 cell
To serve as a confirmation of the presence of sialylation in the ACE2-overexpressing HEK293T-hACE2 cells compared to the normal HEK-293 T cell line, whole cell protein lysates of both cell lines were probed with various lectins using ELISA (Fig. 1). Using 1 µg/ml of each lectin, ELISA showed a significantly higher level of SNA-I lectin binding in HEK293T-hACE2 cells compared to HEK293T cells, which supports previous studies showing that ACE2 receptors are extensively sialylated and accordingly reflected in the increased level of SNA-I binding to the whole cell lysates. Conversely, there were no significant changes in the binding of RCA-I, UEA-I, AAL, and MAA lectins that are specific towards the galactose, terminal fucose, general fucosylation and terminal α2,6-linked sialic acids respectively.
Glycan profiles using lectins of the whole cell lysates of HEK293T and HEK293T-hACE2 cells. The data are mean-normalized and represented as the mean ± SD of three biological replicates; *: p < 0.05, ****: p < 0.0001. ConA Concanavalin A, sWGA succinimidyl-wheatgerm agglutinin, RCA-I Ricinus communis agglutin I, UEA-I Ulex europaeus agglutinin I, AAL Aleuria aurantia lectin, MAA Maakia amurensis agglutinin, SNA-I Sambucus nigra agglutinin I.
Homology-based structural prediction and modeling of the chimeric tsCRD-MrNV-VLPs
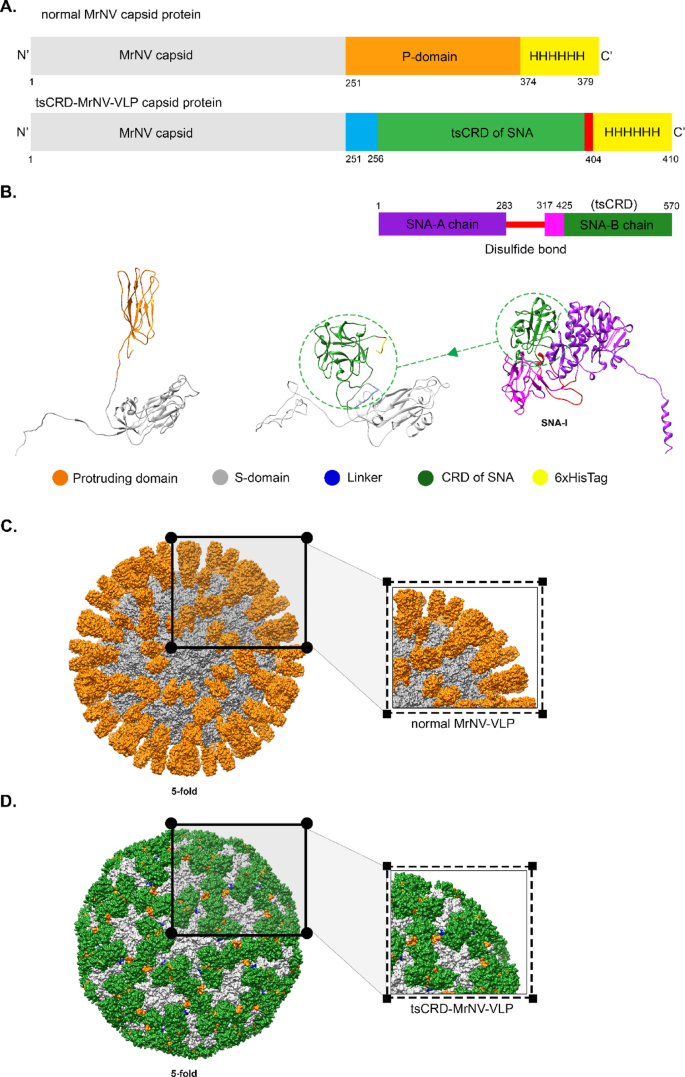
With lectin ELISA assay confirming the rich sialyation in the glycan profiling of HEK293T-hACE2 whole cell lysate, the complex structure of the capsid protein subunit of the normal and chimeric tsCRD-MrNV-VLPs were predicted as shown in Fig. 2C,D. When the P-domain of the normal MrNV capsid protein subunit at amino acids 251–374 (orange ribbon of the leftmost protein structure, Fig. 2B,C) were replaced with the amino acids 425–570 (tsCRD sequence) of the B chain of the lectin SNA-I (green ribbon of the rightmost protein structure, Fig. 2A,B), it could be observed that the CRD sequence of SNA-I completely replaced and rendered as the protruding domain of the tsCRD-MrNV capsid protein subunit. Furthermore, the SNA-I-derived CRDs were predicted to display distinct protruding structure on the capsid surface of all 180 subunits of tsCRD-MrNV-VLPs, as shown by the icosahedral particle modeling (Fig. 2D, green-colored structures) when compared to normal MrNV-VLPs (Fig. 2C, orange-colored structures), which can be observed clearly at the five-fold axis (Fig. 2D inset).

tsCRD-MrNV-VLP structural layout and complex structure prediction. (A) The schematic diagram of the SNA-I lectin and the layout of the construction of chimeric tsCRD-MrNV-VLPs compare with normal MrNV-VLP. (B) In silico ribbon diagram of chimeric tsCRD-MrNV-VLP capsid protein structure prediction generated by PHYRE2 algorithm version 2.0 (http://www.sbg.bio.ic.ac.uk/phyre2) and ChimeraX (https://www.cgl.ucsf.edu/chimera) (C, D) The surface structure prediction of the icosahedral structure of the VLPs comprising 180-repeated subunits of the normal MrNV-VLP and tsCRD-MrNV-VLP at the fivefold view (inset).
The expression of the tsCRD-MrNV capsid gene into E. coli led to the efficient production of virus-like particles with an icosahedral structure
Prior studies have shown the successful production of chimeric MrNV-VLPs in bacterial and SF9 insect cell systems15,16 Chimeric tsCRD-MrNV capsid proteins produced in E. coli BL21 (DE3) yielded a concentration of around 5 mg/L culture after affinity-purifying the capsid proteins. SDS-PAGE examination and Western blotting revealed the presence of the recombinant chimeric tsCRD-MrNV proteins, which had a molecular weight of approximately 46 kDa (Supplement Fig. 1A,B). The protein was detectable from eluted fractions 2 to fraction 6. In addition, the protein profiling of recombinant chimeric tsCRD-MrNV proteins was conducted using Coomassie Blue R250 staining and Western blotting monoclonal anti-hexahistidine antibodies. The results showed a protein band with a molecular weight of approximately 46 kDa for tsCRD-MrNV-VLPs compared to the normal MrNV-VLP molecular weight of approximately 42.5 kDa (Fig. 3A,B).

Expression, purification, and assembly of tsCRD-MrNV-VLPs. (A, B) SDS-PAGE with Coomassie Blue staining and Western blot using anti-6xHisTag comparing the protein band MW between normal MrNV-VLPs and tsCRD-MrNV capsids proteins showed a protein band of ~ 42.5 and ~ 46 kDa. Electron micrographs of normal MrNV-VLPs (C, upper panel) and tsCRD-MrNV-VLPs (C, lower panel) as demonstrated by negative staining. The average size of all VLP particles formed was in the range of 26–29 nm. Bars = 100 nm.
The recombinant chimeric capsid proteins were observed under a TEM microscope. Figure 3C (lower panel) shows that the tsCRD-MrNV capsid protein subunit self-assembled into icosahedral VLPs with an average size in the range of 26–29 nm, which is of similar size compared to normal MrNV-VLPs (Fig. 3C, upper panel). Accordingly, these findings verified that the replacement of the P-domains of the MrNV capsid proteins with the tsCRD of SNA-I did not affect the stability and ability of tsCRD-MrNV capsid protein subunits to self-assemble into fully icosahedral VLPs. Furthermore, the TEM micrographs (Fig. 3C, lower panel) confirmed the slight changes in the general surface topology of the tsCRD-MrNV-VLPs that were predicted in the structure modeling in Fig. 2D, which showed a distinctly less blade-like and more rounded P-domains when compared to those of normal MrNV-VLPs.
The tsCRD-MrNV-VLPs demonstrated both binding specificity and internalization into ACE2 receptor-overexpressing HEK293T-hACE2 cells
HEK293T cells that were genetically modified to overexpress ACE2 receptors (HEK293T-hACE2 cells) were utilized as cellular models that are highly susceptible to SARS-CoV-2 and their pseudovariants infection. Normal HEK293T cells served as a negative control of infection. The binding capabilities of the chimeric tsCRD-MrNV-VLPs to these cells was initially measured by ELISA, which involved assessing the level of binding of the particles to ELISA plates coated with the cell lysates of the cell lines mentioned in the first section of the results. Additionally, the chimeric VLPs’ binding level in ELISA was corroborated qualitatively using immunofluorescent microscopy. The chimeric tsCRD-MrNV-VLPs exhibited significantly higher levels of binding which was concentration dependent to HEK293T-hACE2 lysates compared to the HEK293T lysates; and the levels of binding of tsCRD-MrNV-VLPs were significantly higher than those of MrNV-VLPs at concentrations above 1.25–2.5 µg/ml of VLPs (Fig. 4A).

Binding efficiency of tsCRD-MrNV-VLPs on HEK293T-hACE2 cell. (A) ELISA experiments were used to quantify the level of chimeric tsCRD-MrNV-VLPs binding to wells coated with either HEK293T or HEK293T-hACE2 whole cell lysates. The chimera VLPs were introduced to wells at a dilution range from 20, 10, 5, 2.5, 1.25, 0.625 µg/ml concentrations, in which the chimeric tsCRD-MrNV-VLPs exhibited a significantly higher level of binding for the HEK293T-hACE2 whole cell lysates as compared to that of normal MrNV-VLPs. Data is presented as mean ± SD; level of significance: a = no significance, b = p < 0.05, c = p < 0.001, d = p < 0.0001, e = p < 0.00001, f = p < 0.000001 (B) HEK293T-hACE2 cells were incubated with tsCRD-MrNV-VLPs and were stained with anti-hexahistidine tag antibodies and the corresponding secondary antibody conjugated with Alexa 594 (red) and viewed under a confocal laser scanning microscope. Bars = 40 μm.
The qualitative observation of the cell preferences, binding capabilities, and specificities of the tsCRD-MrNV-VLPs were investigated by incubating the particles with HEK293T and HEK293T-hACE2 cells. Immunofluorescence microscopy revealed that the signals from the red channel which indicated extensive tsCRD-MrNV-VLP binding were observed at the periphery of the HEK293T-hACE2 cells (Fig. 4B, last row), as opposed to the lower red signals in HEK293T cells (Fig. 4B, second row) indicating that chimeric VLPs preferred cells expressing higher levels of ACE2 receptors. In contrast, HEK293T and HEK293T-hACE2 cells treated with normal MrNV-VLPs showed little to no levels of red signals indicating VLP binding (Fig. 4B, first and third row). Therefore, these results suggested that the inclusion of the CRD sequence derived from the SNA-I lectin facilitated the selective binding of chimeric tsCRD-MrNV-VLPs to cells that overexpress receptors that exhibit high levels of sialylation, which is the case of the ACE2 receptor-overexpressing HEK-hACE2 cells.
Furthermore, we have demonstrated that tsCRD-MrNV-VLPs had the ability to selectively internalize into HEK293T-hACE2 cells. Following a 30-min incubation with chimeric-tsCRD-MrNV-VLPs, the red signals indicating the presence of the VLPs were observed within the cytoplasm of HEK293T-hACE2 cells (Fig. 5, last row) as opposed to the relatively lower levels of red fluorescent signals shown in HEK293T cells.

Internalization of tsCRD-MrNV-VLPs into HEK293T and HEK293T-hACE2 cells. The HEK293T-hACE2 cells were treated in a manner consistent with the binding assay using chimeric tsCRD-MrNV-VLPs. The cells were first placed on ice for 30 min and then incubated for an additional 30 min at 37 °C, fixed and probed with anti-hexahistidine antibodies followed by Alexa-594-conjugated secondary antibodies. After incubation, a significant increase in internalization (red fluorescent signals of tsCRD-MrNV-VLPs) into HEK293T-hACE2 cells (lower panels and cell nuclei observable as blue fluorescence of DAPI) could be seen when compared to control and VLP-treated HEK293T cells (upper panels). Bars = 40 μm.
The binding specificity of tsCRD-MrNV-VLPs to HEK293T-hACE2 cell surface terminal sialic acids was further confirmed by ELISA through quantifying the effect of competitive blocking by various lectins on their binding capabilities with whole cell lysate-coated wells. The binding levels of chimeric tsCRD-MrNV-VLPs to HEK293T-hACE2 cell protein lysates were significantly reduced by SNA-I (reduced to 49.6% at 20 µg, 55.6% at 10 µg, 60.6% at 5 µg) more than AAL and sWGA at increasing concentrations when compared to controls (Fig. 6A). While AAL and sWGA were able to reduce binding levels to some degree (AAL reduced to 78.7% at 20 µg, 92.1% at 10 µg, 83.2% at 5 µg vs. sWGA 77.0% at 20 µg, 83.7% at 10 µg, 92.8% at 5 µg); however, it was not unexpected as both can globally block N-glycosites and to a lesser extent O-glycosites in many glycan studies yet higher concentrations did not achieve the levels of blocking to those of SNA-I. Immunofluorescence microscopy revealed that the red signals indicating tsCRD-MrNV-VLPs binding to HEK293T-hACE2 (Fig. 6B, uppermost panels) were significantly reduced and became punctated at the periphery of the HEK293T-hACE2 cells by SNA-I lectin pre-incubation followed by treatment with tsCRD-MrNV-VLPs. Contrastingly, the levels of red fluorescence signals of the chimeric VLPs did not significantly change after pretreating the cells with the AAL and sWGA lectins. All together, these results indicated the high possibility that the binding of chimeric tsCRD-MrNV-VLPs to HEK-hACE2 cells requires interaction with terminal sialic acids that may likely be located on the cell surface of ACE2 receptors (Fig. 6B, second and last row of panels).

Binding of of tsCRD-MrNV-VLPs on HEK293T-hACE2 cells was reduced by pre-blocking of cells with SNA-I lectin. (A) The quantification of the specificity binding of the chimeric VLPs to terminal sialic acids in ACE2-overexpressing HEK293T-hACE2 cell lysates was performed using enzyme-linked immunosorbent assay (ELISA). The whole cell lysate-coated wells were pre-blocked with AAL, SNA, and sWGA lectins at dilutions ranging from 5, 10 and 20 μg/ml., of which then the wells were treated with 5 µg/ml chimeric tsCRD-MrNVs. The chimeric tsCRD-MrNV-VLPs then exhibited a significantly reduced level of binding for the HEK293T-hACE2 cells following incubation with SNA lectin, as compared to the control group. (B) HEK293T-hACE2 cells were incubated with tsCRD-MrNV-VLPs and were stained with anti hexahistidine tag and the corresponding secondary antibody conjugated with Alexa 594 (red) and either viewed by confocal microscopy (bars = 40 μm). In A, data are presented as mean ± SD.
tsCRD-MrNV-VLPs were capable of blocking and reducing various variants of SARS-CoV-2 pseudovirus infection in HEK293-hACE2 cell
We examined the ability of tsCRD-MrNV-VLPs to hinder the binding, internalization, and replication of SARS-CoV2 pseudoviruses in HEK293T-hACE2 cells. The viral replication and infection levels were assessed using luciferase-expressing pseudovirus variants of the SARS-CoV-2 S protein corresponding to the virus titer (Supplement Fig. S2). These differences promote infected cells to produce measurable luciferin. The binding of ACE2 to the S protein produced by the SARS-CoV2 pseudovirus imitates the process of entering and infecting specific cells17,18. As shown in Fig. 7 A-C, at 48 h post-infection, cells expressing luciferin signals indicating pseudovirus SARS-CoV-2 variants (Wuhan, Delta, and BA.2 omicron) infection were decreased after incubation with tsCRD-MrNV-VLPs when compared with SNA lectin for 1 h. To quantify the level of capability of tsCRD-MrNV-VLPs in blocking pseudovirus infection, HEK293T-hACE2 cells were incubated with a mixture of luciferase-expressing SARS-CoV-2 S protein pseudovirus and tsCRD-MrNV-VLPs within 1 h before treatment. The results showed a decrease in the luciferin signals resulting from Wuhan, Delta, and BA.2 omicron types of infection by approximately 49.27%, 57.90%, and 47.16%, respectively, after preincubation with tsCRD-MrNV-VLPs. The cells competitively incubated with tsCRD-MrNV-VLPs showed a decrease in the luciferin signals resulting from Wuhan, Delta, and BA.2 omicron types of infection by approximately 72.25%, 78.26%, and 60.19%, respectively (Fig. 7).

Effect of tsCRD-MrNV-VLPs co-incubation and pre-incubation on the level of infection by SARS-CoV-2 S-protein pseudovirus variants in HEK293T-hACE2 cells. Wuhan (A, D), Omicron BA.2 (B, E), and Delta (C, F) pseudovirus subtypes were used to infect the cells (column 1), compared to cells that were pre-incubated and co-incubated with SNA-I lectin (column 2) and tsCRD-MrNV-VLPs (column 3). Luminescence levels indicating infection in the HEK293T-hACE2 cells were measured after 48 h. (The statistic different calculation by student’s t-test (parametric, two-tailed unpaired, *p < 0.05, ****p < 0.0001)).