
XRP Surges Past Key Resistance, Eyes Further Gains
Bullish Breakout Confirmed Amid Shifting Market Structure
Ripple’s native cryptocurrency, XRP, has successfully navigated out of a prolonged descending wedge pattern, signaling a significant shift in its market’s underlying structure.
XRP’s Technical Breakthrough
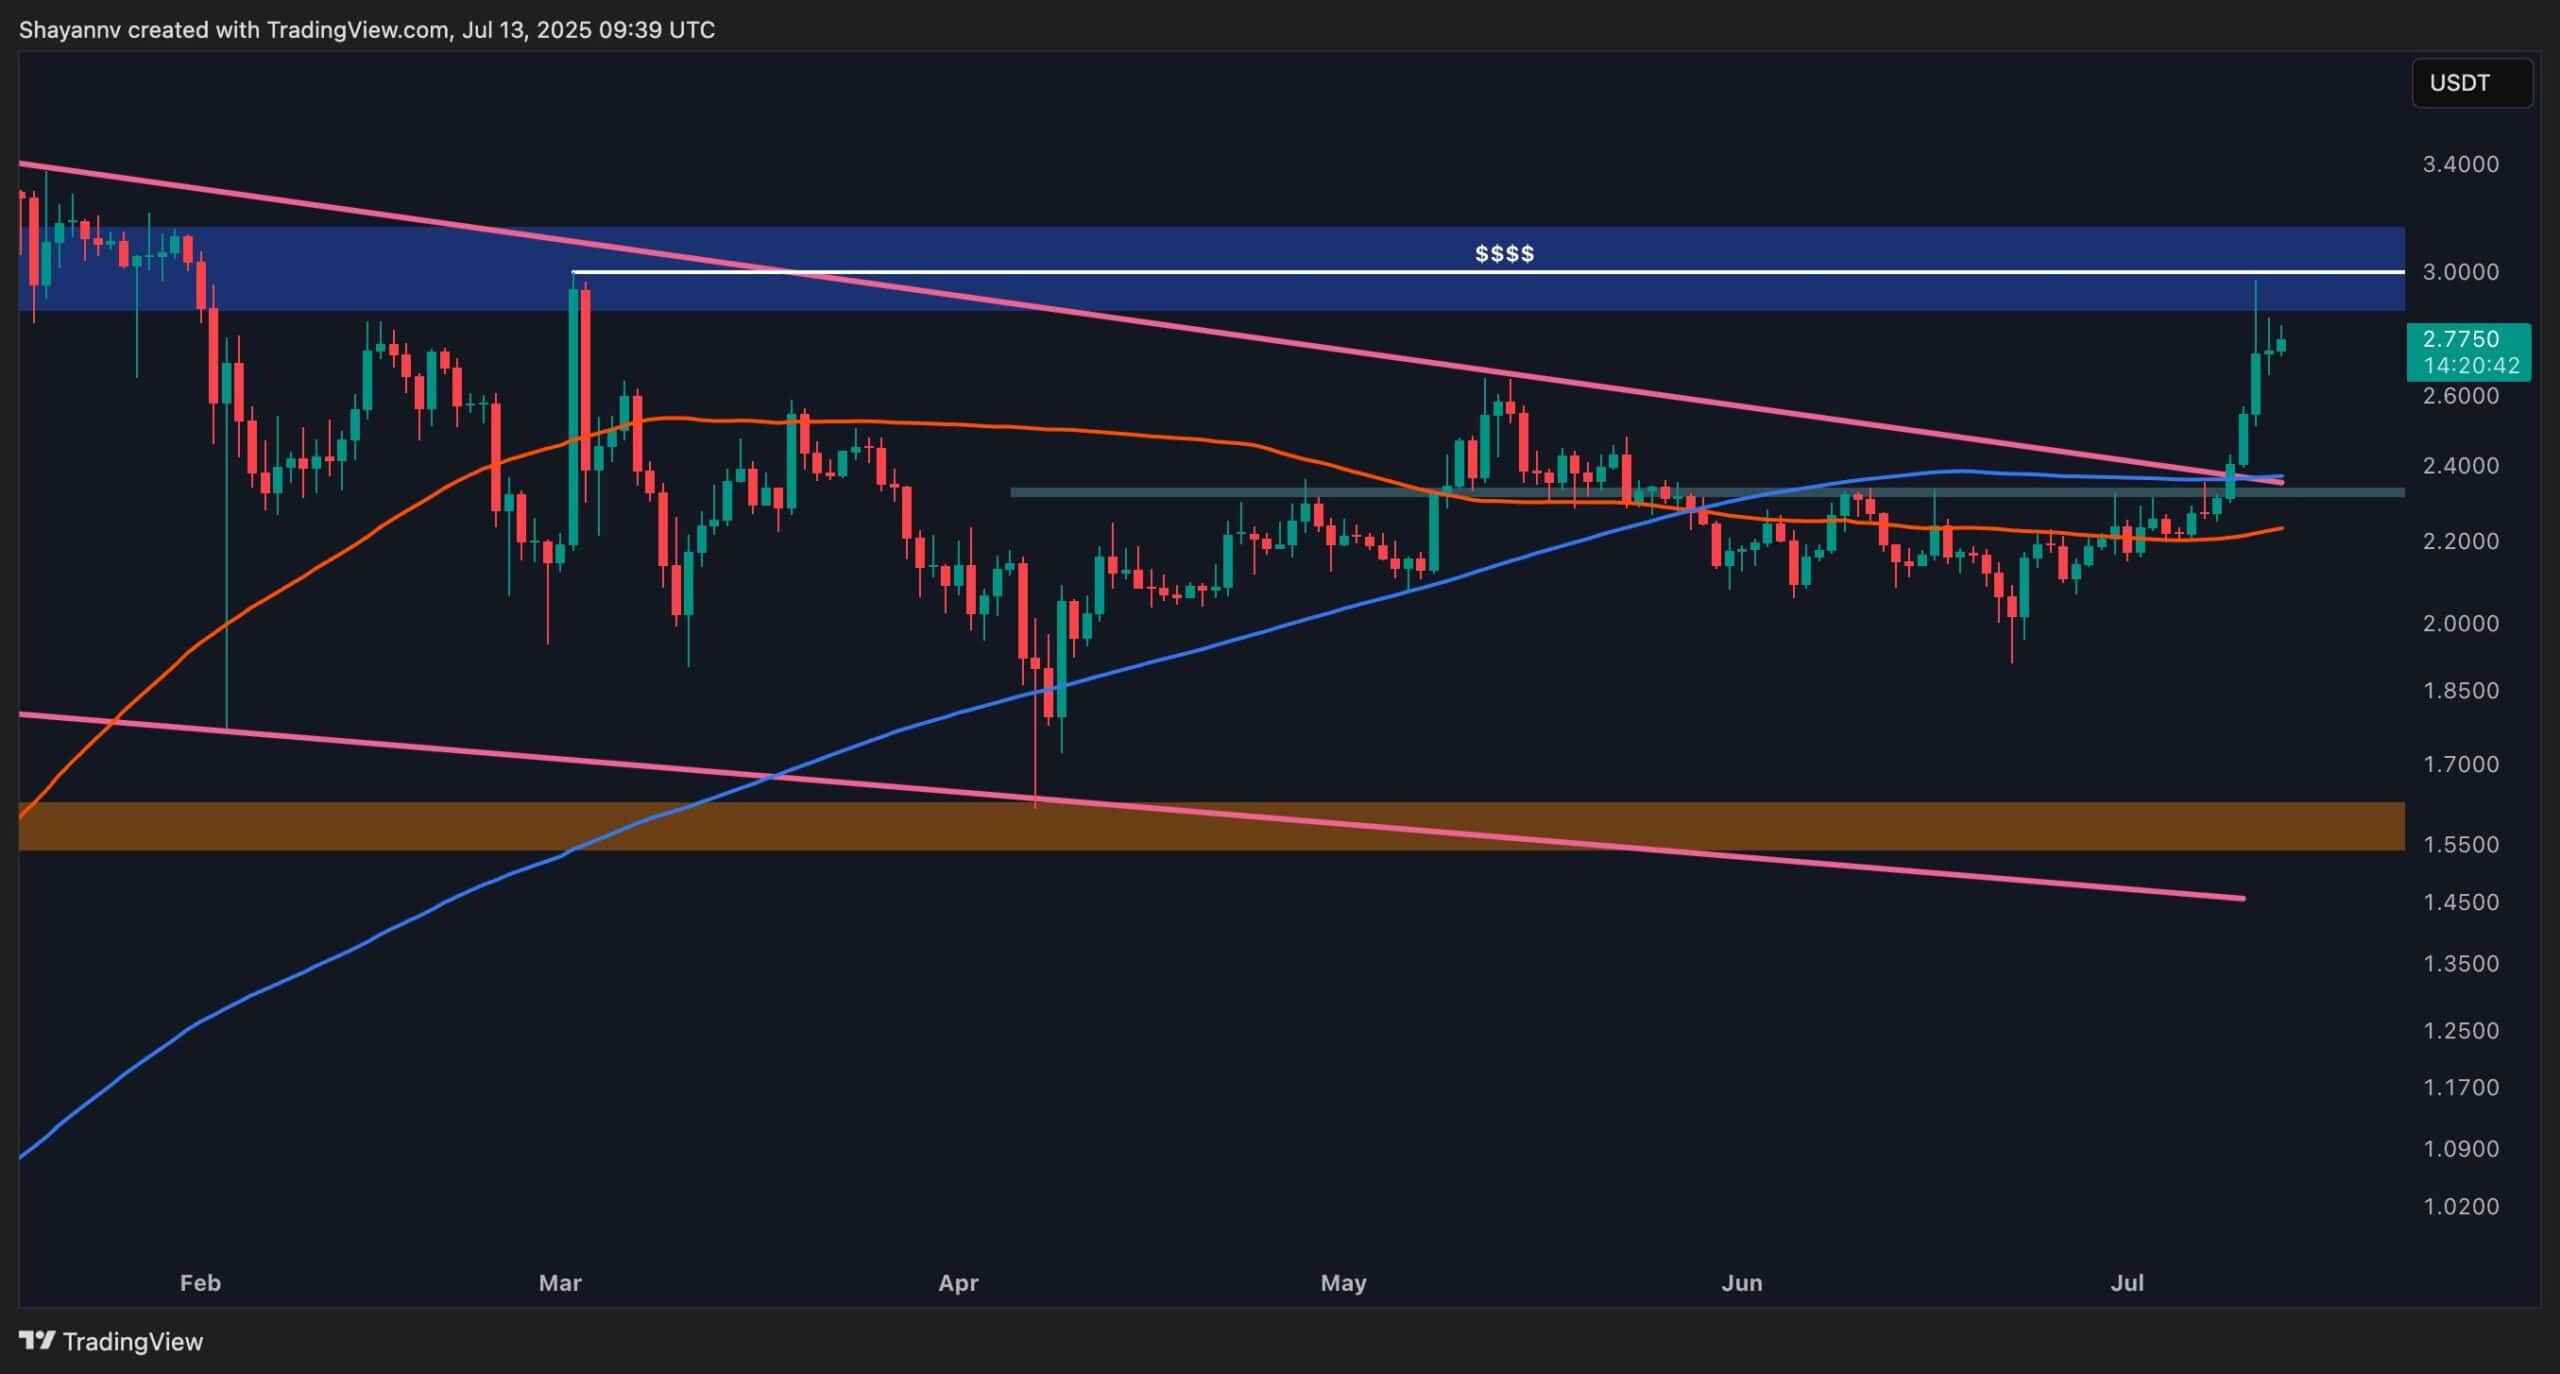
The digital asset has decisively broken above its long-standing descending wedge formation. This technical breakout was further solidified by its ascent above the 200-day moving average, triggering a robust bullish surge that propelled the price toward the $3 mark. This price point is particularly significant as it coincides with XRP’s previous major swing high, acting as a critical resistance level.
However, this critical resistance zone is now presenting a formidable hurdle, with early signs of selling pressure emerging. Consequently, a period of short-term consolidation or a corrective pullback appears likely before any potential continuation of the upward trend. For XRP to sustain its bullish momentum and challenge new all-time highs, reclaiming and maintaining a position above the $3 threshold will be crucial.
4-Hour Chart Insights
Examining the 4-hour chart reveals XRP’s decisive move above the $2.7 resistance, a level that had previously capped its price action for several months. This breakout was characterized by strong bullish momentum, evident in the formation of substantial bullish candles.
Upon reaching the $3 resistance zone, however, this momentum began to wane, leading to a minor rejection. The asset has since pulled back to retest the $2.7 level, which previously acted as resistance and is now expected to serve as support. A resurgence of buying interest at this level could reignite a fresh rally targeting the $3 mark.

Conversely, if the pullback extends, the next significant support area is identified within the 0.5 to 0.618 Fibonacci retracement range. This suggests a possibility of a more extended correction before the next upward leg commences.
This price action occurs as the total cryptocurrency market capitalization recently surpassed $2.5 trillion, indicating renewed investor confidence in the broader digital asset space (CoinMarketCap, 2024).