Satellite Captures Tsunami Formation: Why This Discovery Matters
For decades, our understanding of tsunami propagation has relied on a sparse network of point-sensors—essentially trying to map a forest by looking through a few keyholes. The recent data release regarding the July 29, 2025, Kamchatka event proves that our current spatial sampling is insufficient. We aren’t just missing the considerable picture; we’re missing the physics.
The Tech TL;DR:
- Spatial Leap: The SWOT satellite replaced single-point DART buoy data with 120km-wide high-resolution swaths, revealing “braided” energy patterns.
- Physics Revision: Data suggests the “non-dispersive” packet assumption used in current tsunami forecasting is flawed and requires a fundamental update.
- Event Scale: Captured a magnitude 8.8 subduction-zone rupture that produced waves exceeding 55 feet (17 meters).
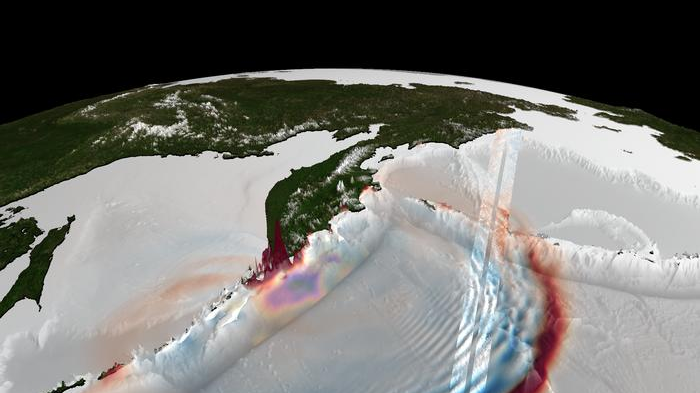
The fundamental bottleneck in tsunami early warning systems has always been the “trench gap.” Deep-ocean Assessment and Reporting of Tsunamis (DART) buoys are the gold standard for sensitivity, but they are architecturally limited: they provide a time series at a single geographic coordinate. If a wave crest misses the buoy, the system is effectively blind to the wave’s geometry. When the Earth’s crust ruptured off Russia’s Kamchatka Peninsula in late July 2025, the resulting magnitude 8.8 earthquake created a displacement that DARTs could sense, but could not map.
Hardware Spec Breakdown: DART vs. SWOT
The deployment of the Surface Water and Ocean Topography (SWOT) satellite—a joint venture between NASA and the French space agency (CNES)—introduces a paradigm shift in data acquisition. Rather than a linear track or a point-sample, SWOT utilizes a wide-swath altimeter to map sea surface height. This allows scientists to observe the tsunami’s geometry as it evolves across both space and time, rather than inferring a 2D field from 1D points.

| Metric | Traditional DART Buoys | SWOT Satellite |
|---|---|---|
| Data Acquisition | Point-source time series | High-resolution spatial swaths |
| Coverage Width | < 1 km (Local sensor) | Up to 120 kilometers (75 miles) |
| Observation Type | Pressure-based (Bottom) | Radar altimetry (Surface) |
| Wave Geometry | Inferred/Simulated | Directly observed “braided” patterns |
The “braided pattern” mentioned in the findings is the critical technical takeaway. Previous models assumed the largest ocean-crossing waves traveled as “non-dispersive” packets—essentially a single, neat crest. The SWOT data reveals a complex scattering of energy dispersing over hundreds of miles. This discrepancy suggests that our predictive algorithms are oversimplifying the fluid dynamics of subduction-zone events.
“I think of SWOT data as a new pair of glasses,” said study lead author Angel Ruiz-Angulo of the University of Iceland. “Before, with DARTs we could only see the tsunami at specific points in the vastness of the ocean.”
Processing this volume of high-resolution geospatial data creates a massive compute overhead. Transitioning from point-data to swath-data requires a significant scale-up in telemetry pipelines and cloud storage. For organizations managing this level of ingestion, the latency between satellite capture and actionable alert is the primary failure point. What we have is why enterprise-grade [Geospatial Data Consultants] are now essential for integrating real-time satellite telemetry into emergency response frameworks.
The Implementation Mandate: Accessing NASA Earthdata
For developers looking to integrate NASA’s SWOT or similar altimetry data into their own simulation engines, the workflow typically involves querying the Earthdata Search API. Even as the raw L2 data is massive, fetching metadata for specific temporal windows (like the July 2025 Kamchatka window) is handled via REST. Below is a conceptual cURL request to authenticate and query the NASA Earthdata granules for ocean topography data.
# Authenticating with NASA Earthdata via Bearer Token curl -X GET "https://cmr.earthdata.nasa.gov/search/granules.json?short_name=SWOT_L2_OCEAN_TOPOGRAPHY&temporal=2025-07-29T00:00:00Z,2025-07-30T23:59:59Z" -H "Authorization: Bearer YOUR_ACCESS_TOKEN" -H "Accept: application/json" -o kamchatka_tsunami_metadata.jsonOnce the granules are identified, the data must be processed through a pipeline capable of handling NetCDF or HDF5 formats. The sheer scale of these files often necessitates the employ of containerized environments and Kubernetes clusters to parallelize the analysis of the “braided” energy fields. Firms struggling with these data-heavy workloads often outsource their infrastructure to [Enterprise Cloud Infrastructure Providers] to avoid local hardware bottlenecks.
Architectural Implications for Forecasting
The realization that tsunami waves are dispersive changes the “blast radius” calculations for coastal cities. If the energy is scattering rather than concentrating in a single crest, the impact zones are more varied and less predictable than linear models suggest. This shifts the requirement from simple “height” alerts to complex “energy distribution” maps.
From a systems perspective, this is a move toward high-fidelity digital twins of the ocean. We are moving away from reactive sensing (waiting for a buoy to be hit) toward proactive mapping (scanning the wave field in real-time). Still, the dependency on a few high-cost assets like SWOT introduces a single point of failure. If the satellite is out of position during a rupture, we revert to the “keyhole” view of the DART network.
As we scale these capabilities, the integration of AI-driven pattern recognition will be required to identify these braided patterns in milliseconds rather than months. The move toward autonomous, satellite-driven early warning systems is inevitable, but only if the underlying physics models are rewritten to match the SWOT observations. For those building the software layers that will handle these alerts, auditing the reliability of the data pipeline is paramount, necessitating the use of vetted [Software QA and Audit Agencies] to ensure zero-latency delivery of life-saving data.
The Kamchatka event was a rare “natural experiment” that exposed the fragility of our current ocean-monitoring stack. We have the hardware to see the truth; now we require the mathematical models to catch up. The era of the “single crest” is over; the era of the “braided wave” has begun.
Disclaimer: The technical analyses and security protocols detailed in this article are for informational purposes only. Always consult with certified IT and cybersecurity professionals before altering enterprise networks or handling sensitive data.