
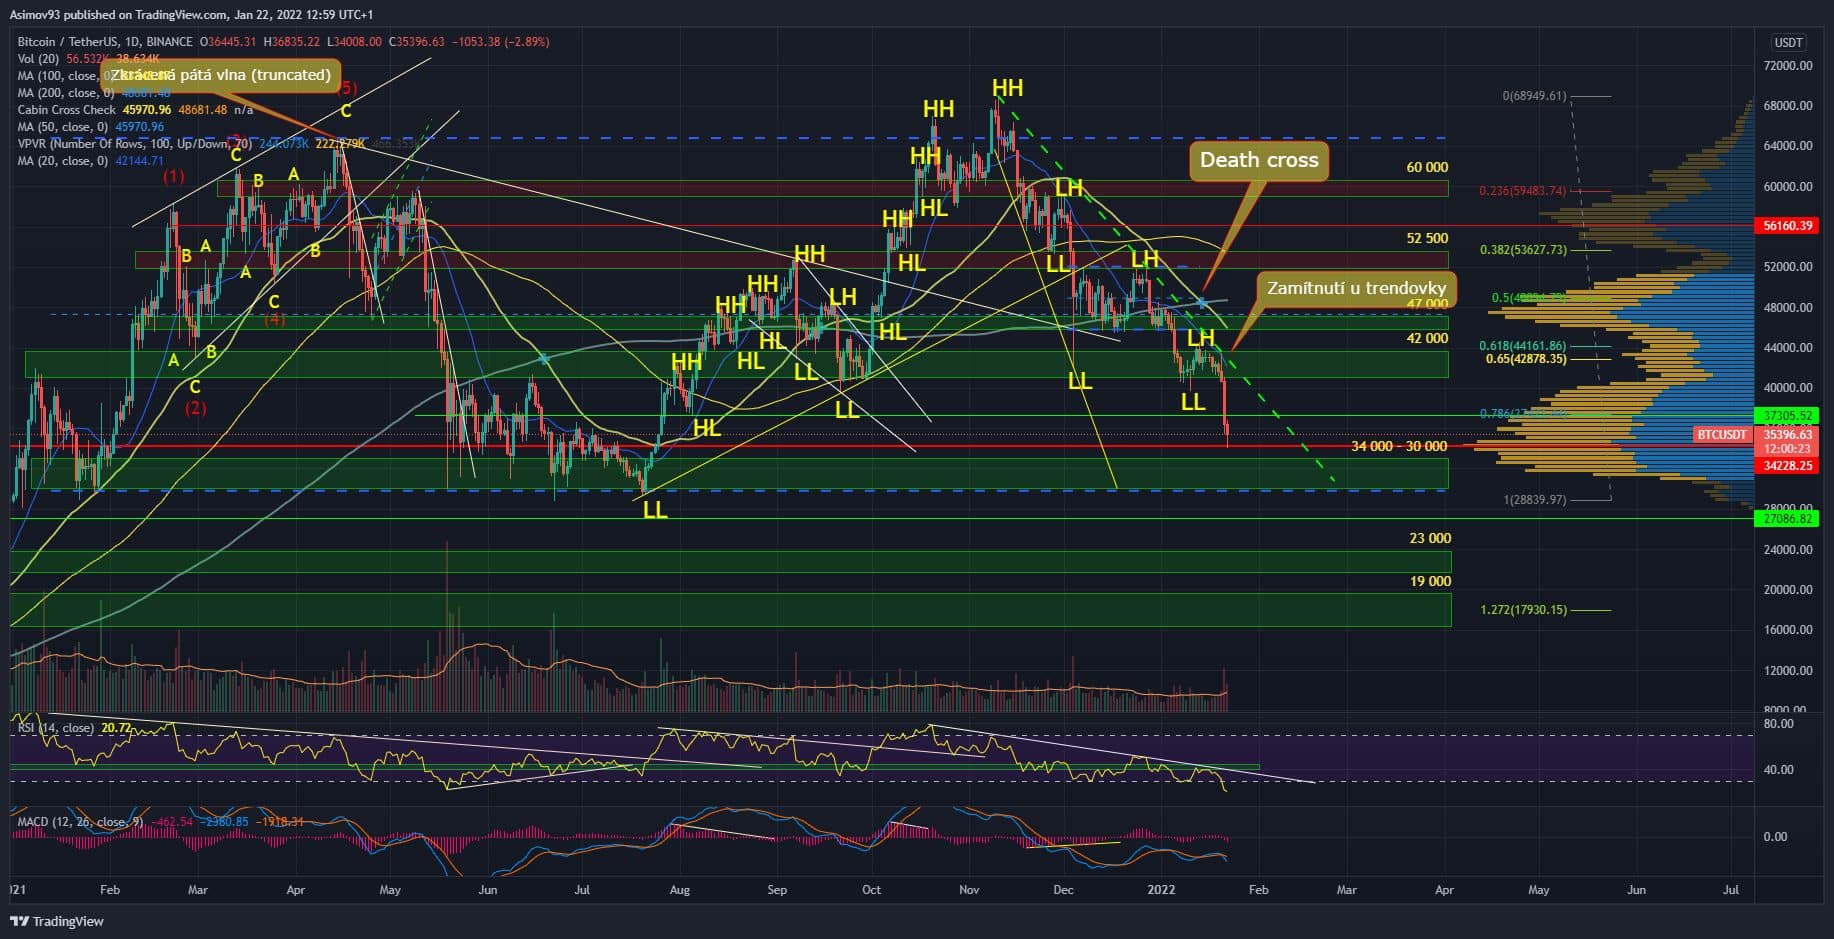
Bitcoin (BTC) eventually broke further support, which is around $ 37,000, further deepening the price drop. Now, of course, everyone is wondering if we have finally reached the expected local bottom. Naturally, no one will tell you 100%, but I would venture to say that we are very close.
Current situation at 1D BTC / USD
So Bitcoin broke S/R levelwhich is located around 37,000 USD. It was a rather weaker level, where I expected the decline to slow down. Which is what really happened. In any case, the breakthrough of the said level caused another drop, which got us to point of control and volume profile. In essence, this is the upper limit of the large support band, which is in the range of 30,000 – 34,000 USD.
The point of control course ran and the initiative was immediately known to the shoppers. Which is a very good sign, because it is in the aforementioned support zone that most of us already assume that it is a local bottom. Of course I think the same. That $ 30,000 would only fall if there were any very unexpected negative events.
And with such things, of course, it’s hard to calculate in any way. Therefore, if there is no extreme situation, panic, total flash crash, support below us, the selling pressure on the BTC market should rather stop.
Otherwise, there is a logical probability that once bitcoin has tested the point of control, it will be enough for the market as a strong enough signal for reflection. In other words, there is no guarantee that bitcoin will penetrate deeper into the support band. However, I would say that from a technical point of view, it makes the most sense. So we’ll see.
Indicators
Daily RSI is already very deep in oversold values - 20 points. However, I would like to point out that the market can remain below those 30 points for a relatively long time – even a whole week. Among other things, this means that there will be an opportunity to create bull divergences. But there is not much room left for potential decline.
In conclusion
We’ll see how it turns out for bitcoin daily close. If it looks worse, it will rather indicate that the decline has not yet stopped completely. If we see some solid Pin bar large volumes in the chart, maybe we already have the local bottom. But be careful here – it really depends on the weekly close. Currently, the weekly candle looks like Mordor.
ATTENTION: No data in the article is an investment board. The analysis does not try to predict future price developments. It serves exclusively as an educational text on how to approach the market mentally. Before you invest, do your own research and analysis, you always trade at your own risk. The kryptomagazin.cz team strongly recommends individual risk considerations!
–
